
When you first log into Google Analytics, it’s easy to feel overwhelmed.
Charts, metrics, technical terms—most of it seems useful, yet none of it is immediately clear.
We all know data drives better decisions, but the challenge lies in turning the data in front of you into meaningful insights that actually improve performance.
In fact, nearly half of marketing professionals say they struggle to make sense of their analytics.
That’s exactly what this guide is here to fix.
Whether you're managing a campaign or improving a client’s site, this beginner-friendly walkthrough simplifies Google Analytics data analysis so you can:
- Understand your website traffic and audience behavior
- Track what’s working—and what needs work
- Optimize content, user experience, and marketing campaigns
Let’s get into it—and turn your data into decisions that drive results.
1. Setting Up Google Analytics: Laying the Foundation for Accurate Data
Before you can analyze anything, you need to make sure your data is being tracked correctly.
Setting up Google Analytics 4 (GA4) is the first step—and getting it right means every future insight will be reliable.
Step 1: Create Your Google Analytics Account
To get started:
- Go to analytics.google.com and sign in with your Google account.
- Click Start measuring to begin the setup process.
- Enter your account name (e.g., your business or website name).
- Adjust data-sharing settings as needed, then click Next.
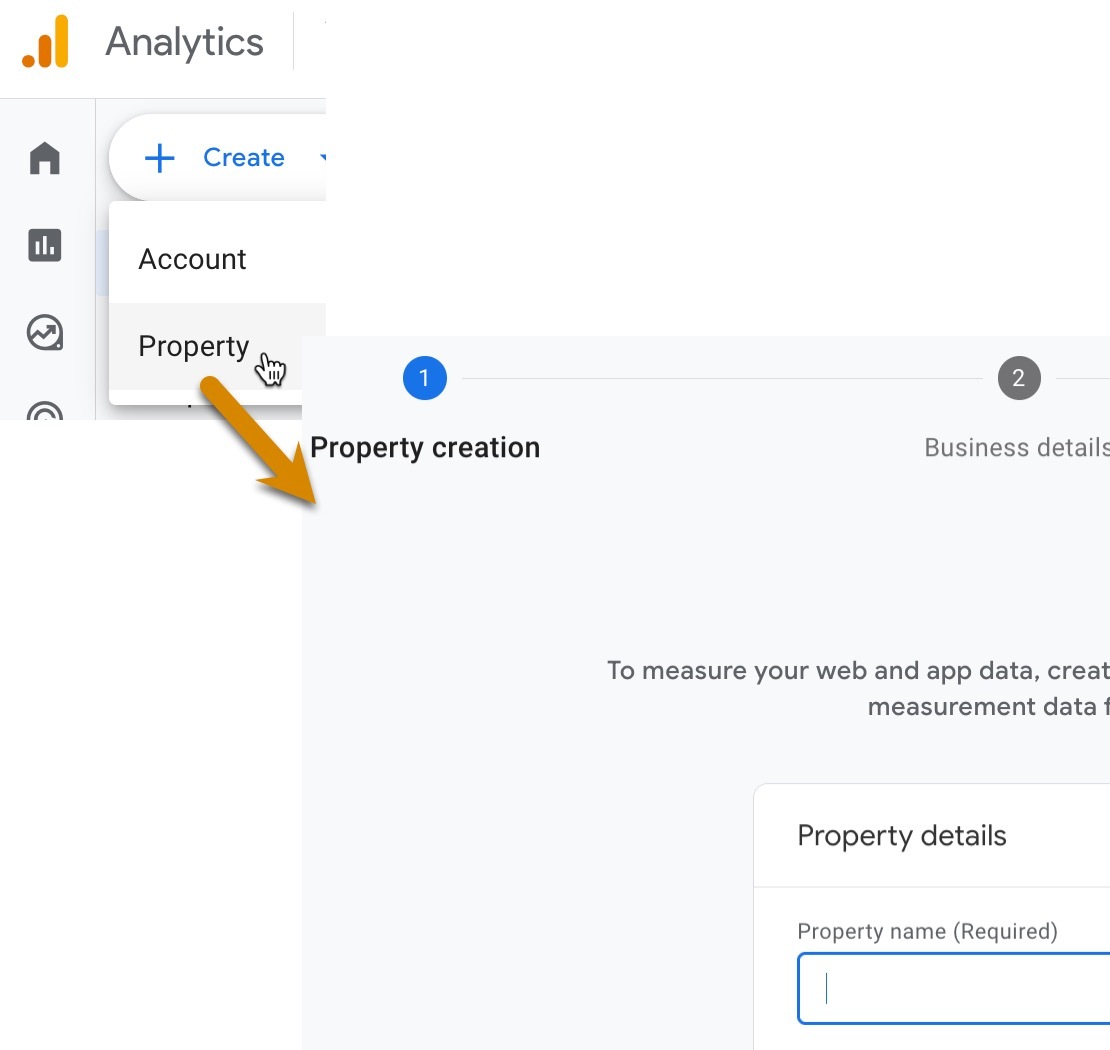
Step 2: Set Up a Property (Your Website)
- Enter a property name (this is typically your website).
- Choose your reporting time zone and currency.
- Click Next, then fill in your business details—industry, size, and what you want to measure (e.g., lead generation, online sales).
- Accept the terms of service to complete your account setup.
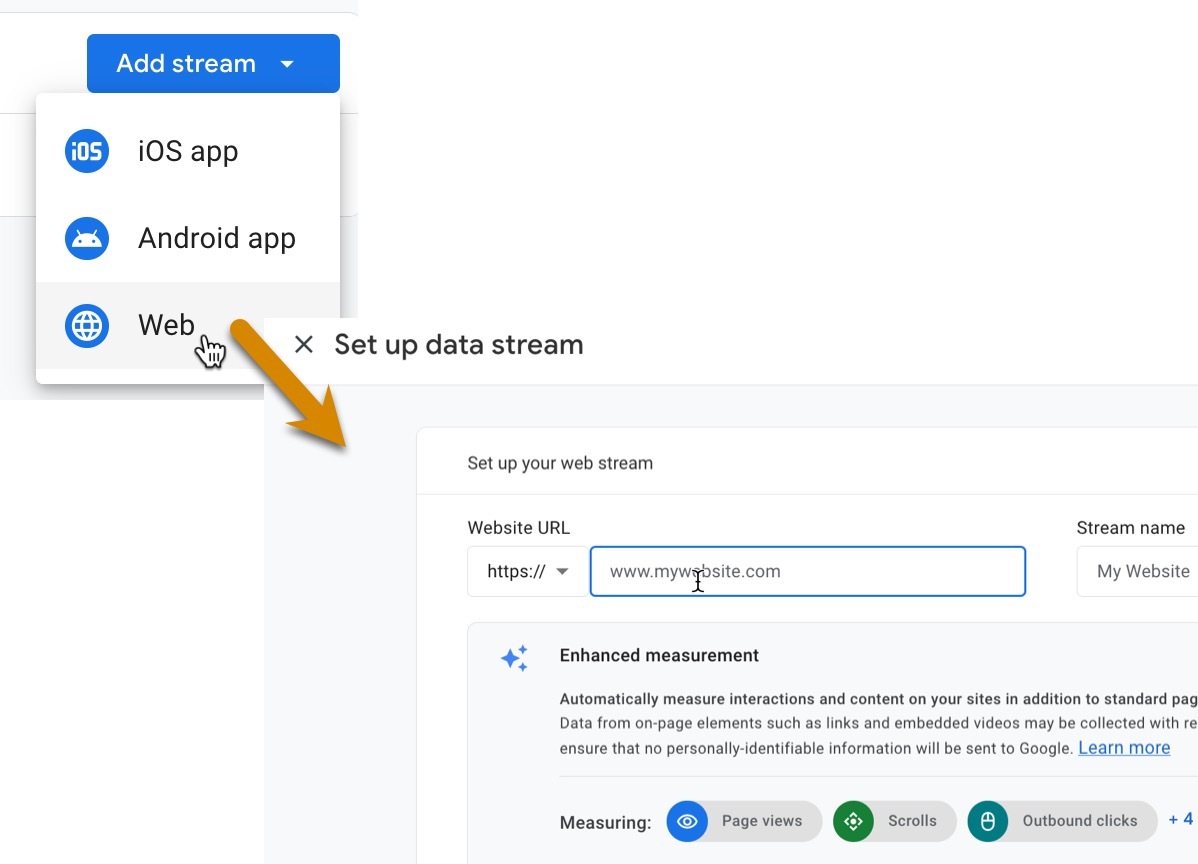
Step 3: Add a Data Stream
- Choose Web as your platform (unless you’re tracking an app).
- Enter your website URL and give your stream a name (e.g., “Main Site”).
- Enable Enhanced Measurement if you want to automatically track actions like scrolls, video views, and file downloads.
- Click Create stream—you’ll receive a Measurement ID (format: G-XXXXXXXXXX).
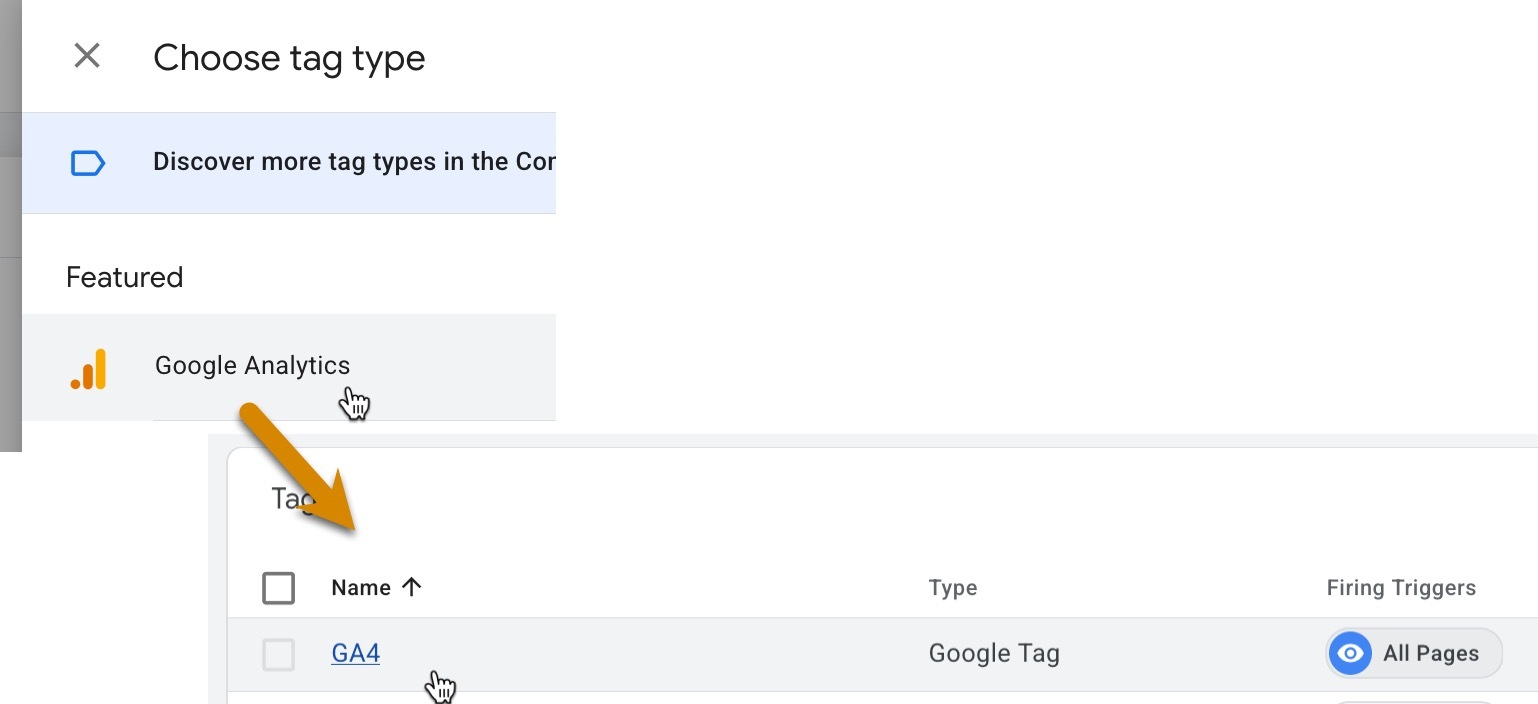
Step 4: Install the Tracking Code
There are two main ways to add your tracking code:
This method is more flexible and easier to manage over time. In GTM, create a new tag using your GA4 Measurement ID and publish it across your site.
Copy the global site tag (gtag.js) from your GA4 setup and paste it into the <head> section of your website’s HTML.
If you’re using WordPress, many themes and plugins offer built-in options for adding your GA code without editing code manually.
Step 5: Verify That Data Is Tracking
Once installed:
- Head back to your GA4 dashboard.
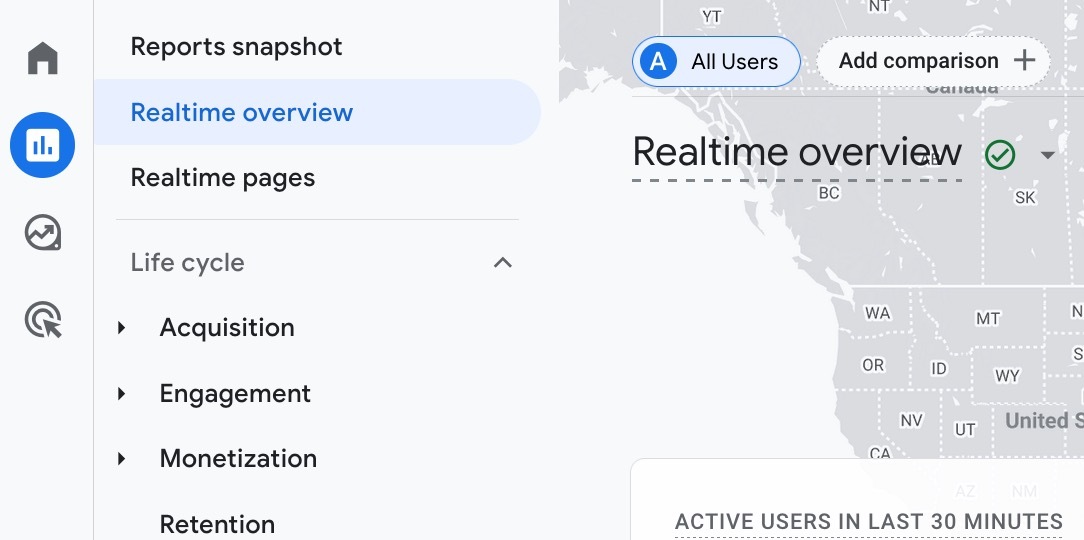
- Open the Realtime overview report and visit your website in another tab.
- If your visit shows up, your tracking is working.
Accurate setup ensures that every report you analyze later reflects real user behavior—no guesswork, no blind spots.
2. Navigating the Google Analytics Dashboard: Find the Insights That Matter
Once your tracking is in place, it’s time to explore the Google Analytics dashboard, which acts as your control center for understanding how visitors interact with your site.
Google Analytics 4 (GA4) provides a cleaner, more event-based structure than previous versions.
While that’s great for flexibility, it can be hard to get to grips with initially.
Here’s how to cut through the noise and focus on the reports that matter most.
Get Familiar with Key Reports
GA4 organizes data into a few primary report categories:
- Realtime—see who’s on your site right now, what pages they’re viewing, and what actions they’re taking. This is great for checking tracking in real time or monitoring a campaign launch.
- Audience (Users)—understand who your visitors are—where they’re from, their devices, and what languages they speak. This helps tailor your content and design for your actual users.
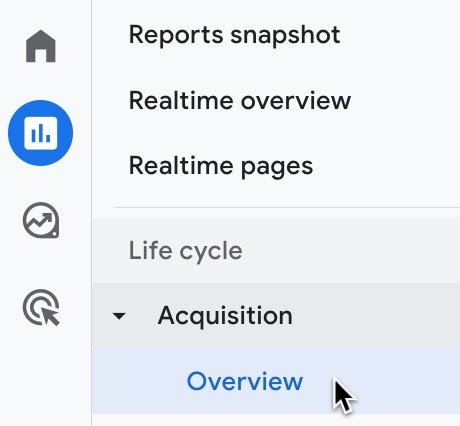
- Acquisition—find out how people found your site—organic search, social media, paid ads, referrals, or direct traffic.
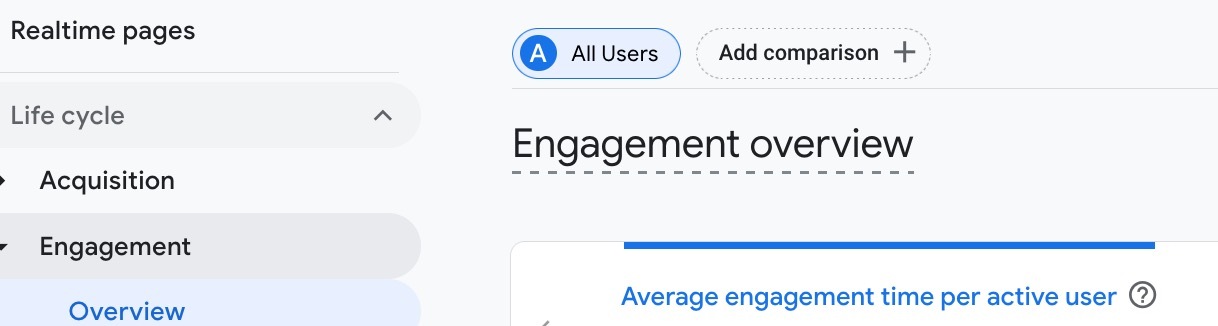
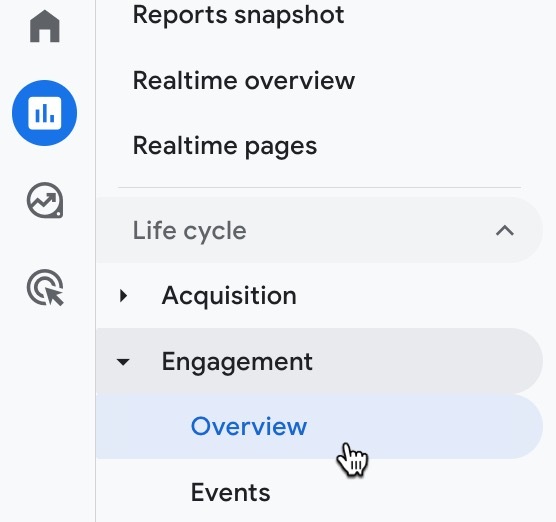
- Engagement—dive into how visitors interact with your site. Which pages do they view most? How long do they stay? What actions do they take?
- Conversions—track goal completions—like form submissions, purchases, or other key actions you’ve defined.
Key Metrics to Know
There are hundreds of metrics in GA4, but here are the ones that truly matter early on:
- Users—the number of unique visitors to your site
- Sessions—total visits, including repeat visits from the same user
- Engagement Rate—the percentage of sessions where users stayed, clicked, or interacted
- Average Engagement Time—a more useful version of time-on-page in GA4
- Conversions—completed actions you’ve marked as goals (e.g., purchases, form fills)
Engagement rate replaces bounce rate in GA4. A high engagement rate means users are interacting with your content—exactly what you want.
Customize Your Dashboard for Speed and Focus
One of the best features in GA4?
The ability to create custom dashboards with just the metrics that matter to you,
This helps make your daily or weekly check-ins faster and more focused.
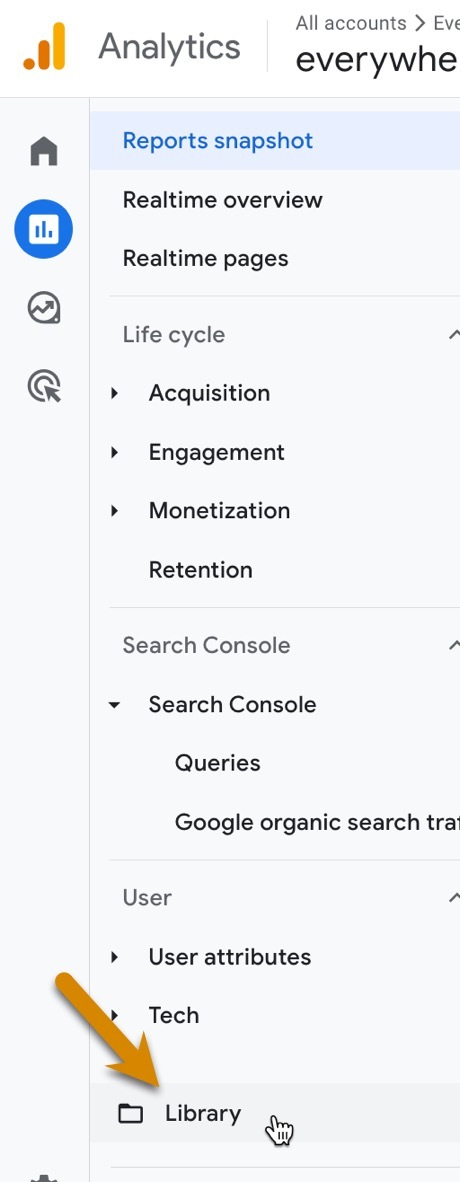
- Use the Library to access existing report templates
- Customize them by choosing the dimensions and metrics most relevant to your goals
- Pin your favorite reports to the home screen for quick access
This personalization keeps you laser-focused on performance drivers—whether that’s traffic from SEO, form submissions, or time spent on key landing pages.
Your dashboard isn’t just a data dump—it’s a decision-making tool. Customize it to surface the metrics that matter most to your goals.Click To Post On3. Analyzing Audience Data: Know Who’s Visiting and What They Need
To make your website and campaigns perform better, you need to understand who’s actually using your site—and how.
Google Analytics gives you detailed audience insights that go beyond just traffic volume.
It shows you:
When used right, these insights help you tailor your content, design, and strategy to match real user needs.
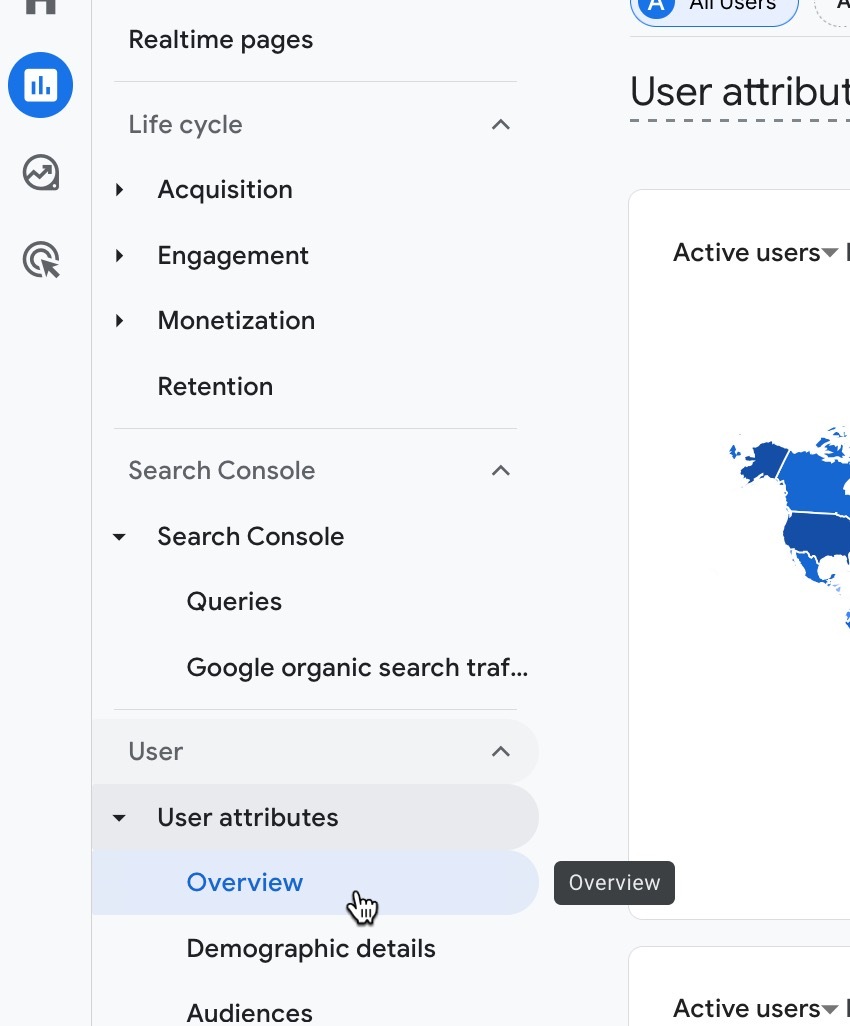
Understand Demographics and Location
GA4 offers data on key user demographics including:
These details reveal who’s most interested in your content—and who might be missing.
If you notice a large share of users are aged 18–24 but your content is geared toward a 35+ audience, it might be time to adjust your messaging or visuals.
Running ads? Align your ad targeting settings with the demographics that perform best on your site.
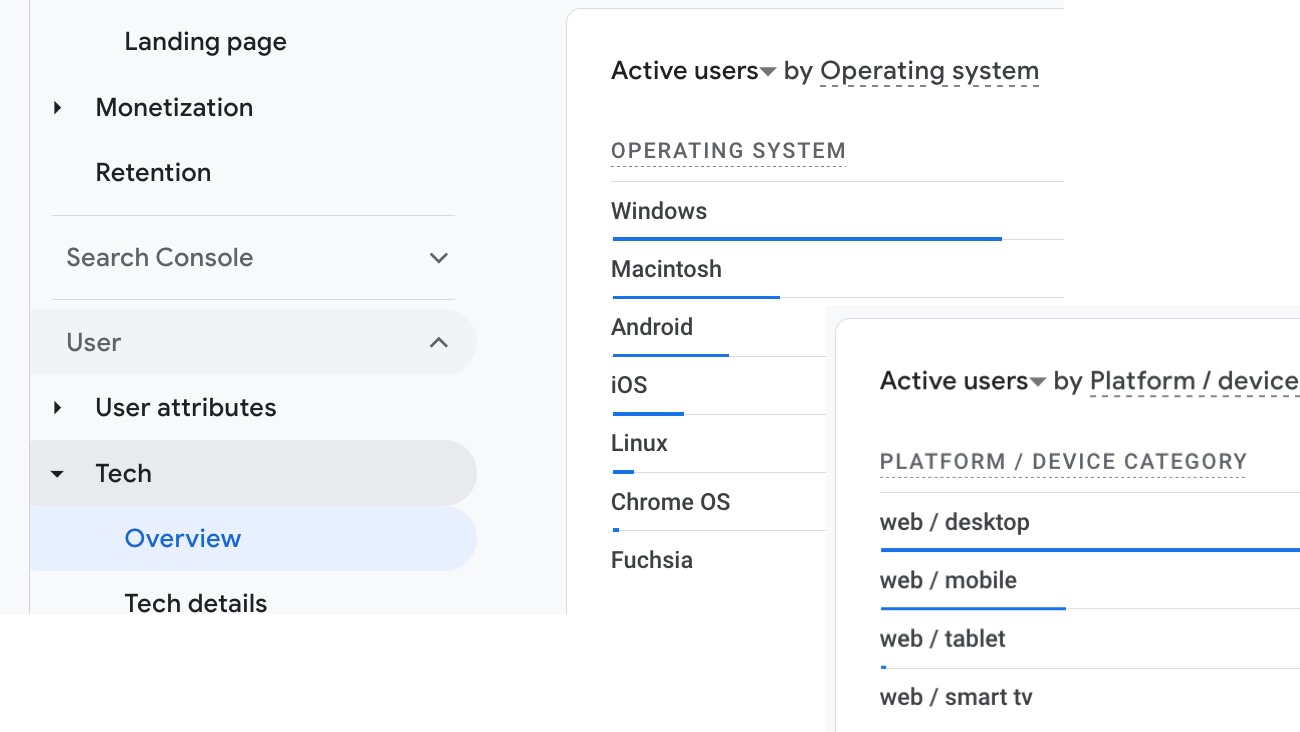
Track Devices and Browsers
One of the fastest wins in data analysis is ensuring your site works flawlessly where your users are.
In GA4, you can quickly see:
Why does this matter?
- As of early 2025, over 63% of global web traffic comes from mobile devices (Statcounter).
If your mobile engagement metrics lag behind desktop, you may be dealing with slow load times, poor layout, or usability issues on smaller screens.
Use this data to prioritize responsive design and mobile UX fixes.
Identify Behavior Patterns
Dig deeper into how users interact over time:
These insights help you answer questions like:
- Are visitors returning because they find value?
- Are first-time users sticking around or bouncing quickly?
- Is your content engaging enough to build loyalty?
Use behavior trends to build remarketing lists or create tailored content campaigns for returning users.
4. Measuring Traffic Sources (Acquisition Report)
One of the most powerful insights in Google Analytics is understanding how people are finding your website.
That’s where the Acquisition report comes in.
It breaks down your traffic by channel—so you can pinpoint which sources are driving results and where you might be wasting time or budget.
Break Down Your Traffic by Channel
In GA4, traffic sources are grouped into key default channels. Here’s what each one tells you:
Each channel gives you insight into your marketing mix:
- Are you relying too heavily on one source?
- Are you underutilizing a high-performing channel?
Look beyond volume. Compare engagement metrics and conversions across channels to see which sources actually perform.
Track SEO Performance with Search Console Integration
To get deeper visibility into your organic traffic, integrate GA4 with Google Search Console.
This unlocks additional reports showing:
- Top-performing search queries
- Impressions and click-through rates (CTR)
- Landing pages generating the most search traffic

These insights help you refine your SEO strategy and double down on the keywords that drive real traffic.
Look for queries with high impressions but low CTR—they’re prime candidates for title or meta description optimization.
Evaluate Social and Ad Campaigns
If you’re running campaigns on platforms like Instagram, LinkedIn, or Google Ads, the Acquisition report helps you compare their performance in one place.
With the right UTM parameters in place, you can drill down into:
- Which ads or posts are driving the most traffic
- How engaged that traffic is
- Which campaigns lead to conversions
Use this data to shift budget away from underperforming platforms and scale what’s working.
5. Understanding User Behavior: See What Visitors Do on Your Site
Traffic is only half the picture.
To truly improve performance, you need to understand what visitors do after they land on your site.
That’s where the Engagement Report in Google Analytics 4 becomes essential.
This report helps you analyze which pages keep people interested, which ones push them away, and how users navigate through your content.
Identify Your Top-Performing Pages
Start by reviewing the Pages and Screens section within the Engagement Report.
This shows:
If a specific blog post or landing page consistently drives high engagement or conversions, you’ve found a content asset worth promoting, updating, or replicating.
A page with high views but low engagement time could indicate weak content—or that it’s not delivering what users expected.
Monitor Engagement Metrics
Key behavior metrics to watch include:
- Engagement rate—the percentage of sessions where users actively interacted—by staying at least 10 seconds, clicking, or viewing multiple pages.
- Bounce rate (now redefined in GA4)—the percentage of sessions that did not qualify as “engaged.” A high bounce rate often signals content mismatch, slow load times, or unclear CTAs.
How do you know if your bounce rate is high?
- According to Contentsquare, the average bounce rate for eCommerce websites is 47%, giving you a valuable benchmark against which to compare.
- Average engagement time—shows how long users are actively engaging—not just lingering on the page.
- Event data (scrolls, clicks, video plays)—auto-tracked in GA4 if Enhanced Measurement is on.
Aim for a high engagement rate and low bounce rate—both indicators of content that connects and drives action.
If engagement is low, test changes to layout, headlines, or CTAs to keep users engaged longer.
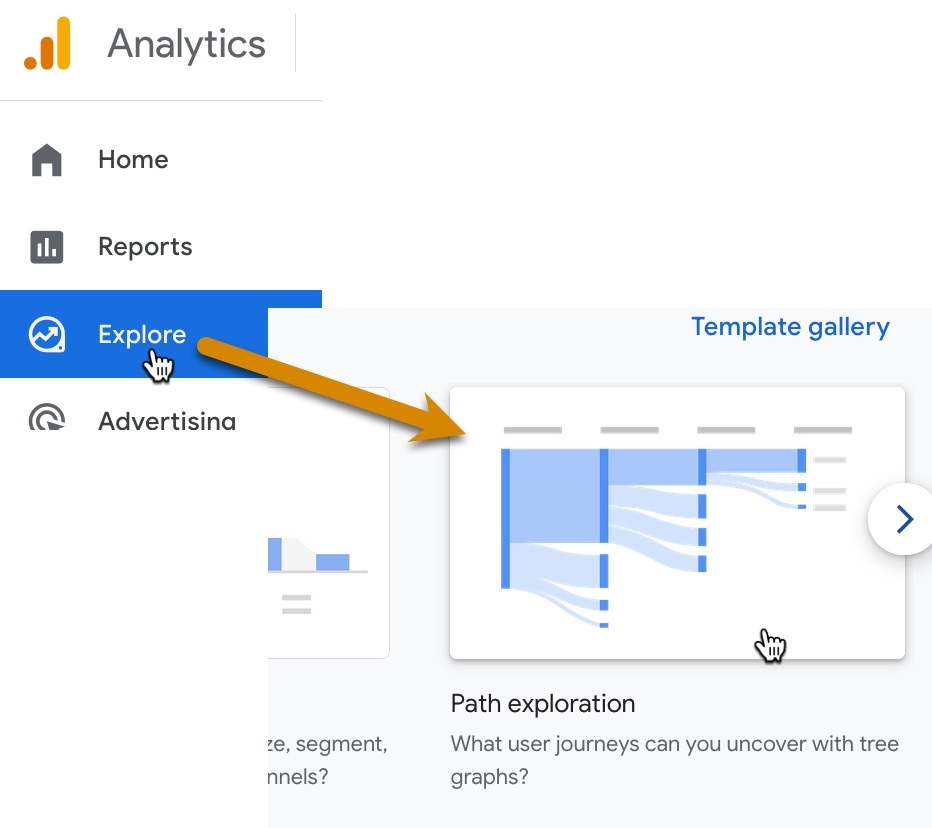
Analyze Click Paths and User Flow
GA4’s Path Exploration tool shows how users navigate from one page or event to the next. You can quickly uncover:
This insight reveals friction points—like users dropping off at critical moments or looping between pages without converting.
If users exit on your product page, test faster load times, refine the messaging, or streamline the next action.
6. Tracking Conversions and Goals
Page views and sessions are nice—but what really drives business growth is conversions.
Whether that’s a newsletter signup, a purchase, or a form submission, you need to track these actions to know what’s working (and what’s not).
In GA4, conversions are more flexible and powerful than in previous versions—but they do require some initial setup.
Define Your Key Conversion Goals
Start by identifying the high-value actions on your site, such as:
These are the goals you’ll track and optimize toward.
Focus on conversions that align with your core business objectives—not just vanity metrics like downloads or page views.
Set Up Conversions in GA4
In GA4, conversions are created from events.
Here’s how to track them:
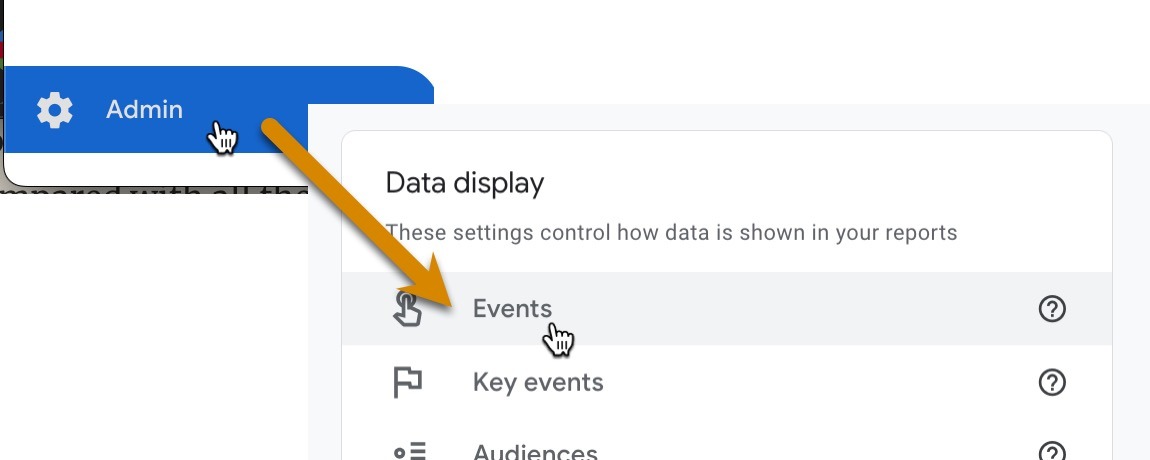
- Navigate to Admin > Events in your GA4 property.
- Find the event you want to mark as a conversion (or create a new one).
- Toggle the Mark as conversion switch to ON.
If you don’t see the event you want, use Google Tag Manager or set up a custom event to capture the specific action (e.g., click on a CTA button or thank-you page view).
To track a form submission, you can set an event for the URL of the thank-you page users see after submitting.
Use UTM Parameters for Campaign-Level Tracking
If you’re running email campaigns, social ads, or influencer partnerships, use UTM parameters to see exactly which efforts drive results.
These short tags are added to URLs and help GA4 attribute traffic and conversions to the right source.
Example UTM link: https://yourdomain.com/offer?utm_source=linkedin&utm_medium=paid&utm_campaign=spring_launch
Track performance by:
- Traffic source
- Campaign name
- Medium (e.g., “email,” “paid,” “organic”)
Compare conversion rates across campaigns to see which channels and creatives deliver the highest ROI.
Analyze Your Conversion Funnel
Once you’ve set up your goals, use Exploration reports in GA4 to map out your conversion funnel:
This helps you identify friction points and opportunities to improve your funnel performance.
If users abandon the checkout page, consider simplifying the form, adding trust signals, or reducing page load times.
7. Generating and Interpreting Reports: Turn Analytics into Action
Collecting data is one thing. Knowing what to do with it is another.
Google Analytics 4 offers flexible reporting tools that help you surface the right insights—whether you're reviewing performance weekly or preparing data for stakeholders.
The key is knowing which reports to use, how to customize them, and how to automate your workflow.
Start with Pre-Built Reports
GA4 comes with built-in reports that provide instant access to your most important data. These include:
- Audience overview—demographics, device use, new vs. returning users
- Acquisition—where your traffic comes from—search, social, ads, referrals
- Engagement—top pages, user interaction, engagement rate
- Conversions—which actions are driving business results
These are a great starting point for beginners, giving you a snapshot of what’s working across your site.
Bookmark your most-used reports or pin them to your dashboard for quick access.
Create Custom Reports to Match Business Goals
Need to track something specific—like how blog traffic from LinkedIn converts, or how product pages perform over time?
That’s where Custom Reports or Exploration Reports in GA4 come in (and you can have up to 150 of them per property).
To create one:
- Go to Explore in GA4.
- Choose a report type (Free Form, Funnel, Path, etc.).
- Define your dimensions (e.g., traffic source, landing page) and metrics (e.g., conversion rate, engagement time).
- Use filters to focus the report on your campaign, audience segment, or timeframe.
Build a custom funnel report to see how users move from homepage to product page to checkout.
Automate Reporting to Save Time
No need to manually generate reports each week.
GA4 lets you schedule automated reports to be sent via email:
- Open the report you want to share.
- Click the Share icon.
- Choose Schedule Email and set the frequency (e.g., weekly, monthly).
- Select recipients and format (PDF, Excel).
This is ideal for keeping stakeholders in the loop without creating slides or spreadsheets from scratch.
Smart reporting helps you shift from reactive to proactive marketing—spotting trends, acting on data, and keeping everyone aligned without wasting time.
8. Next Steps: Applying Insights for Growth
Once you’ve set up tracking, explored the reports, and started to understand what’s happening on your site—it’s time for the most important step: using that data to drive growth.
Google Analytics isn’t just about looking at numbers. It’s about making smarter, faster decisions based on what the numbers tell you.
Data without action is noise. Use your analytics to refine strategy, optimize content, and drive measurable growth.Click To Post OnOptimize Content That’s Already Working
Check which blog posts, landing pages, or product pages are driving the most engagement and conversions.
Then:
If a blog post about “SEO trends” is outperforming others, consider creating a follow-up, a downloadable checklist, or a webinar on the topic.
Fix Bottlenecks and High-Bounce Pages
Look for pages with high bounce rates or low engagement—especially if they’re part of a conversion path.
- Test different headlines or CTAs
- Improve load times (especially on mobile)
- Refine layout and messaging for clarity and trust
Improving your top-exit product page by even 1–2% in conversions could significantly impact monthly revenue.
Refine Your Marketing Strategy
Use GA4’s attribution and conversion data to evaluate what channels are actually moving the needle.
- Shift budget away from underperforming ads
- Double down on high-ROI sources (e.g., organic search, email)
- Create segmented remarketing campaigns for high-intent users
Align campaign planning with real-time data—don't just assume what’s working. Let the data guide your next creative or promotion.
Frequently Asked Questions
How do I set up Google Analytics 4?
To set up Google Analytics 4, create an account, set up a property for your website, add a data stream, install the tracking code, and verify that data is tracking.
What are some key metrics and reports to focus on in Google Analytics 4?
Focus on metrics like Users, Sessions, Engagement Rate, and Conversions. Explore key reports like Realtime, Audience, Acquisition, Engagement, and Conversions.
Why is it essential to track user behavior in Google Analytics?
Tracking user behavior helps understand how visitors interact with your site, identify high-performing content, optimize for conversions, and improve overall user experience.
How can I track traffic sources and evaluate their performance in Google Analytics?
In Google Analytics, use the Acquisition report to track traffic by channel (Organic search, Paid search, Social, Referral, Direct, Email) and compare their performance to optimize marketing efforts.
What steps are involved in setting up and tracking conversions in Google Analytics 4?
Define key conversion goals, set up conversions from events, use UTM parameters for campaign tracking, and analyze the conversion funnel to track and optimize actions that drive results.
To Conclude
Google Analytics gives you the information you need to improve how your website and marketing perform.
But the value comes from applying what you see—identifying which pages keep users engaged, which channels bring in qualified traffic, and where conversions are being lost.
With the basics in place, you can start using your data to make more informed decisions and better allocate your time and budget.
Open your reports, review the trends, and take the next practical step. It’s not about tracking everything—it’s about focusing on what will move your results forward.